Dashboard#
The dashboard allows you to determine which groups are effectively managing their vulnerability management operations and which groups require improvement.
Navigate to "Groupset > Dashboard" to display information for each group.
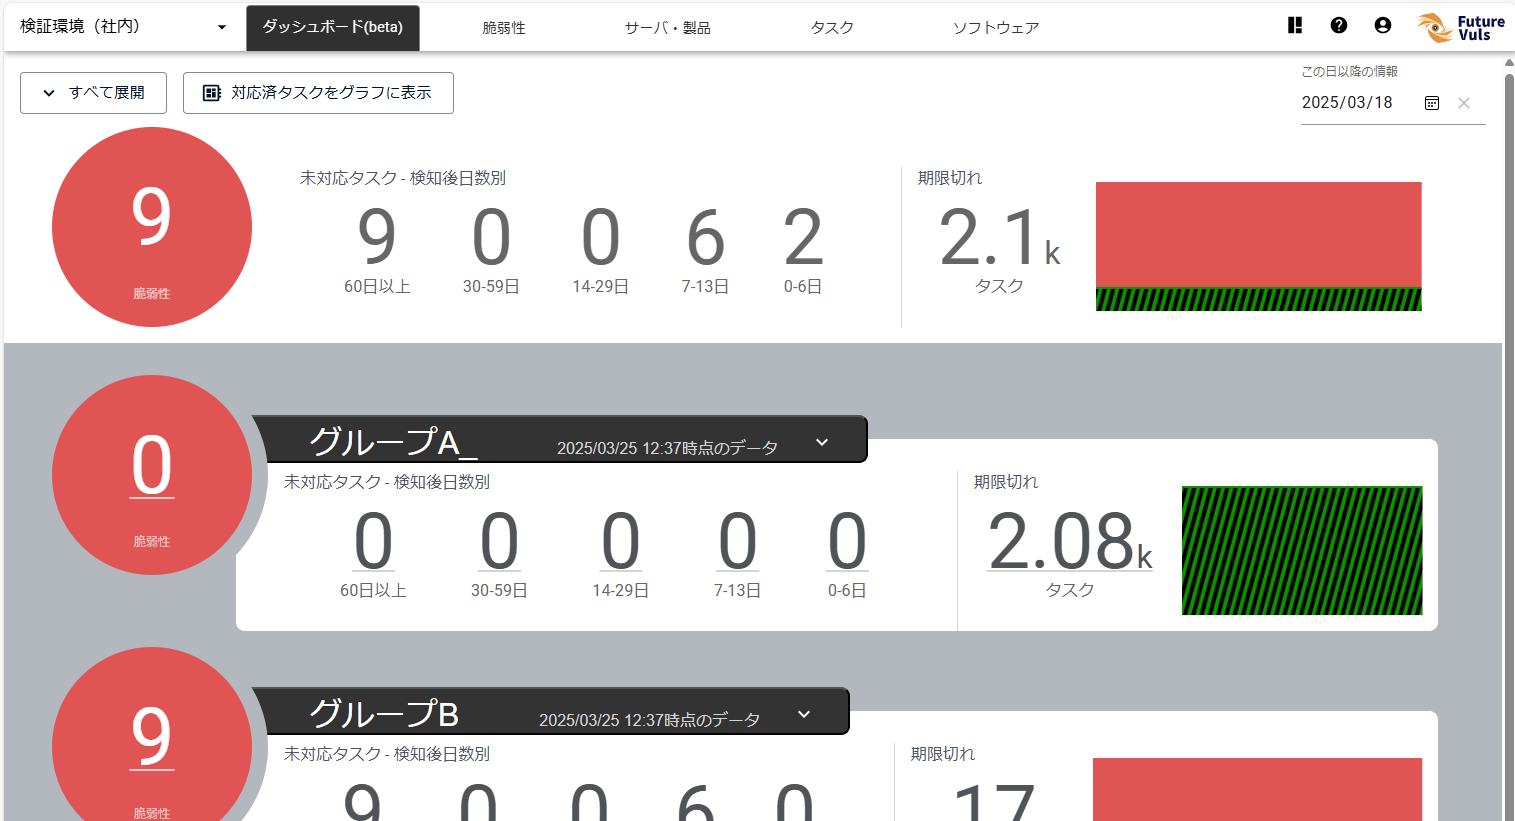
Select a group name to expand the graph.
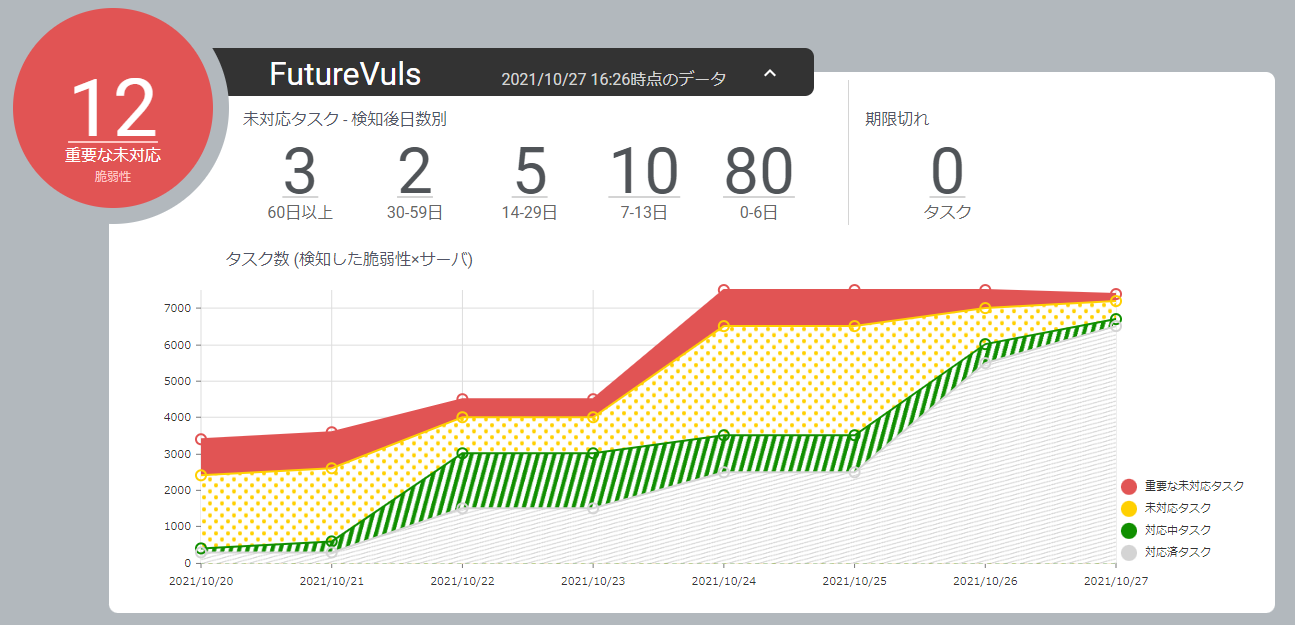
When the gray "Completed Tasks" area increases daily, as shown in the graph below, it indicates a group that is successfully responding to detected vulnerabilities and whose operations are running smoothly.
On the other hand, an increase in the red and yellow areas, as shown in the graph below, indicates that the number of neglected vulnerabilities is increasing daily. This indicates that the group's vulnerability management operations are not running smoothly. This group needs to improve its operational methods and structure.
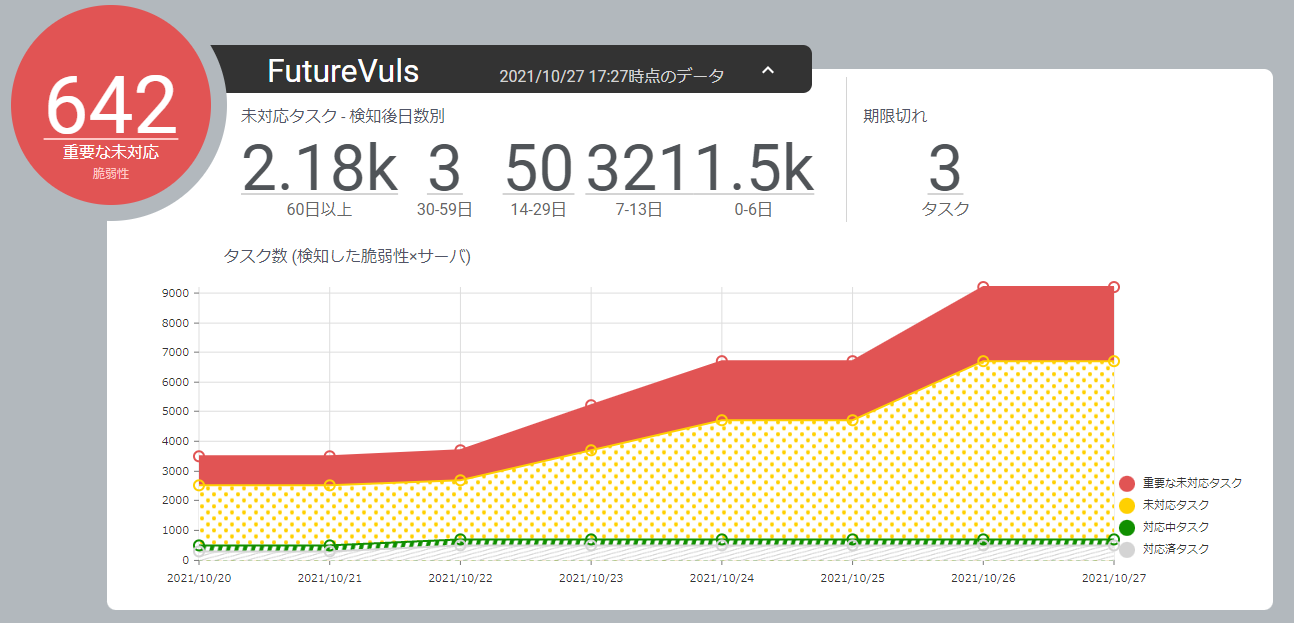
This lets you determine at a glance which groups have effective vulnerability management operations and which ones need improvement.
Note that clicking on a number on the dashboard will take you to the corresponding group's page with the relevant filters applied.
| Item | Description | Update Frequency |
|---|---|---|
| Important CVE | Displays the number of vulnerabilities assigned to "Important CVE" that remain in the group. | Every hour |
| Remaining tasks | Displays the number of remaining tasks categorized by the number of days elapsed since detection. You can check how many tasks have remained unaddressed for an extended period since detection. | Every hour |
| Expired tasks | Displays the number of expired open tasks. | Every hour |
| Task Count Trend Graph | Displays the daily vulnerability count trend for a group by task status (Important Open Tasks, Other Open Tasks, Ongoing Tasks, Completed Tasks). Completed tasks can be displayed by selecting "Show Closed Tasks" at the top of the screen. - The horizontal axis of the graph (display period) can be changed by editing the date in "Information on or after this date" at the top right of the screen. - The vertical axis of the graph (number of vulnerabilities) represents the total count for each status as of the date on the horizontal axis. |
Every hour |